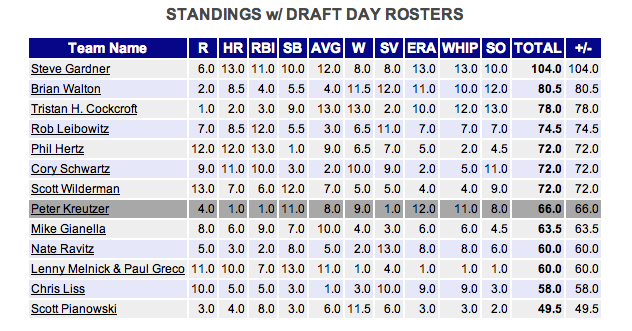
Steve Gardner had to catch up with Brian Walton in August, on his way to a championship, but it was Walton who made the biggest gains with his inseason moves.
| Owner | Draft | EOS | Diff |
| Walton | 80.5 | 103.5 | 23 |
| Gardner | 104 | 112.5 | 8.5 |
| Liss | 58 | 63.5 | 5.5 |
| Kreutzer | 66 | 71 | 5 |
| Melnick/Greco | 60 | 65 | 5 |
| Leibowitz | 74.5 | 79 | 4.5 |
| Pianowski | 49.5 | 51 | 1.5 |
| Cockcroft | 78 | 78 | 0 |
| Gianella | 63.5 | 62.5 | -1 |
| Wilderman | 72 | 68 | -4 |
| Ravitz | 60 | 50.5 | -9.5 |
| Hertz | 72 | 62 | -10 |
| Schwartz | 72 | 43.5 | -28.5 |


Absolutely. The Hypothetical Standings tell you what you had to work with after your draft. Teams that finish high did a good job, they didn’t buy Adam Dunn, but also are more likely to have avoided injuries.
P.S. Then it would also appear to include a decent dose of luck of avoidance from injury as well as good in-season moves, correct?
Thanks for the clarifying responses. Looks like some tools I should familiarize myself with.
The report is actually called the Draft Day Standings and it’s found in the Toy Box at onRoto. It always shows just the stats for the teams based on their draft day roster, not projections. (There is also a projected standings, with two different reports, one based on the Marcel projections for the rest of the year, and the other on the baseballHQ.com projections for the rest of the year.
It always looked like I was going to do very well using Marcel, which makes me the monkey.
These standings aren’t the projections. If you used this link on opening day, then they would be.
They include to-date real stats, plus projections going forward from those stats. So in reality, since there are no more games being played, these are in fact just the real numbers if we left our teams in place without making transactions, not the original onroto.com projected standings.
I’m sorry I wasn’t clearer with the explanation: The Hypotheticals show the actual stats of each team’s actual draft day roster. If we played Draft and Hold, the Hypothetical standings would be the Draft and Hold league’s final standings. So, any deviation can be attributed to the moves the owners made during the year.
In the case of the NL, if we’d just let the league play out without spending all that time trying to improve our teams, the top four teams would have remained the same, with Leibowitz and Cockcroft flipping places, and Gardner with a much bigger lead.
I’ll take the praise, but would have preferred the crown! (Again, congrats to Steve, the deserving NL winner.)
Anyway, without understanding the methodology and underlying projections used, how do we know that my big improvement was due to in-season moves? Instead, maybe I just drafted players that the source of the projections had undervalued before the season. (Obviously, I suspect more of the latter than the former but am interested in learning more.)
Any insight on this, please?